Hak Atas Kekayaan Intelektual (HAKI)

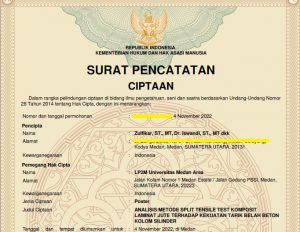
Medan – Sabtu, 05 Nopember 2022. Pemerintah Republik Indonesia melalui Kemenkumham, Dirjen Kekayaan Intelektual telah menerbitkan Sertifikat Hak atas Kekayaan Intelektual terhadap hasil penelitian dan kerja keras yang telah dilakukan oleh tim riset Bahan Komposit Laminat Jute dan Hibrid, Program Studi Teknik Mesin (PSTM), Fakultas Teknik, Universitas Medan Area (UMA). Adapun nama-nama peneliti yang tertera dalam sertifikat HAKI tersebut ialah:
1. Zulfikar, ST. MT. (Ketua Peneliti)
2. Dr. Iswandi, ST. MT. (Wakil Ketua Peneliti)
3. Nurul Hidayat (Anggota Peneliti)

Judul HAKI: ANALISIS METODE SPLIT TENSILE TEST KOMPOSIT LAMINAT JUTE TERHADAP KEKUATAN TARIK BELAH BETON KOLOM SILINDER

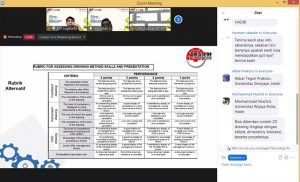
Assessment Mata Kuliah Gambar Mesin

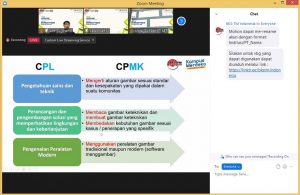
Medan – Kamis, 03 Nopember 2022. Badan Kerja Sama Teknik Mesin (BKS-TM) Indonesia mengadakan kegiatan webinar dengan topik “Assessment Mata Kuliah Gambar Mesin” yang diadakan secara virtual menggunakan media Zoom Meeting. Narasumber dalam kegiatan ini ialah Bapak Ubaidillah, ST., M.Sc., Ph.D., Bapak Arif Sugiharto, ST. MT., dan Bapak Dr.-Ing. Ridho Irwansyah. Turut hadir dan sekaligus membuka kegiatan tersebut ialah Sekretaris Jendral BKS-TM Indonesia, yaitu Bapak Prof. Dr. Ario Sunar Baskoro. Dalam kegiatan ini, rubrik penilaian mata kuliah Gambar Mesin dijelaskan secara lengkap oleh para Narasumber. Hasil yang diharapkan ialah terbentuknya keseragaman kurikulum untuk mata kuliah ini di Program Studi / Jurusan Teknik Mesin di seluruh Indonesia.

Interpretation of Boxplot Graph

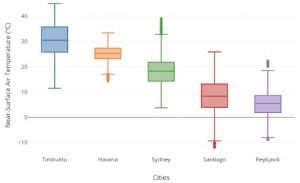
Medan – November 1st, 2022. At this time, the development of science and technology is so rapid that from time to time there are only the latest techniques that appear to interpret the conditions of the test result data. Currently, a method of displaying test data that is gaining popularity and is widely used is the Boxplot graph method. This method was developed from the basic principle of the five statistical series, namely the maximum value, upper quartile, median, lower quartile, and minimum value.

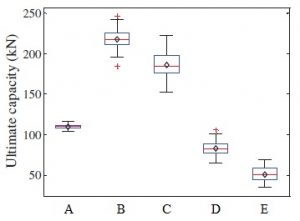
One interpretation of the Boxplot graph is to provide an overview of the data distribution conditions from the test results. An example is the Boxplot graphic image above. In the graph, it can be seen that the load capacity of variation B is higher compared to other variations. The data range of variation B ranges from 190 to 240 kN and the average value ranges from 220 to 230 kN. However, the best data distribution is found in variation A because the variation is very small compared to the shape of a denser (thinner) box.